Monday, April 4
• 2011-04-04 12Z - forecast only
• 2011-04-04 06Z - forecast only
• 2011-04-04 00Z - forecast only

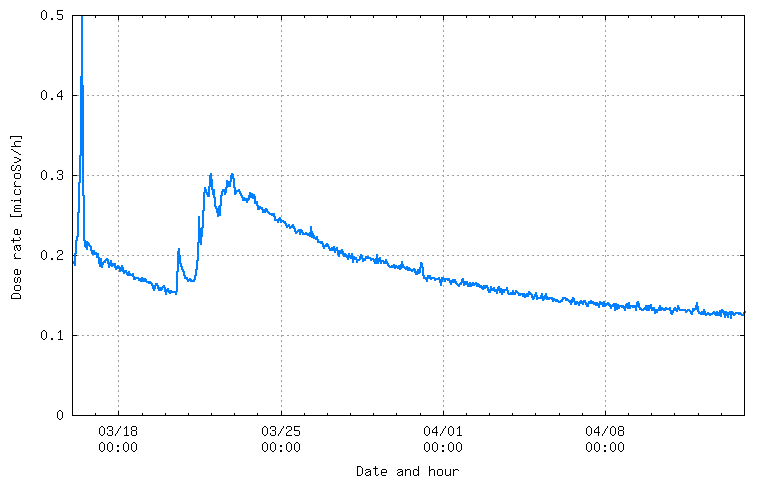
I also found some readings from KEK in Tokyo, that are similar but more frequently updated than the SPEED! measurements. They are here and here. As shown earlier, these measurements show several spikes stemming from the releases from the reactors and a larger set of bump starting around March 21st that seem to correlate with the pool cooling events. As soon as the pools are filled, i.e. cooled, the sources terms stops immediately.
At the start of the accidents, there was not much data with regards to the source term at Fukushima, i.e how much elements were escaping from the reactors. Most of the computations performed by different groups were focused on a worst case scenario of continuous release, which was never supported by any of the SPEED! measurements. The simulations include:
- Special Forecast products for Fukushima produced by NILU-ATMOS (disclaimer: These products are highly uncertain based on limited information for the source terms. Please use with caution and understand that the values are likely to change once we obtain more information on the overall nature of the accident. The products should be considered informational and only indicate 'worst case scenario' releases. From what we've learned recently, it seems releases of this magnitude have not yet occurred. Furthermore, these modeling products are based on global meteorological data, which are too coarse to provide reliable details of the transport of the plume across Japan.)
- Eurad simulations. (Fukushima site) Disclaimer: This simulation is a so called "worst case scenario" with continuous release rate. The value of 0001 Bq / m 3 correspond to appr. one millionth of the concentration at the source. At distances more than appr. 2000 km away from the source, the concentrations are not harmful to health. The simulation starts at fictitious 15.03. 00 UTC and will continue to run in order to Demonstrate the InterContinental. Relaese exact transport When rates are published we will restart the simulation with reliable values.
When given more data from the CTBTO, the german Eurad model was re-run and the dispersion model was compared as to when CTBTO stations would detect the plume from the Fukushima plant. The animated gif is here.

and seems to show a pretty good fit with regards to when the stations would detect elements given the new simulations. Finally, an NOAA HYSPLIT model is currently being run by somebody which seems to give similar result with regards to particle trajectories. It is here.
No comments:
Post a Comment