Showing posts with label atmosphere. Show all posts

Wednesday, December 28, 2011

Fukushima: 9 Months later

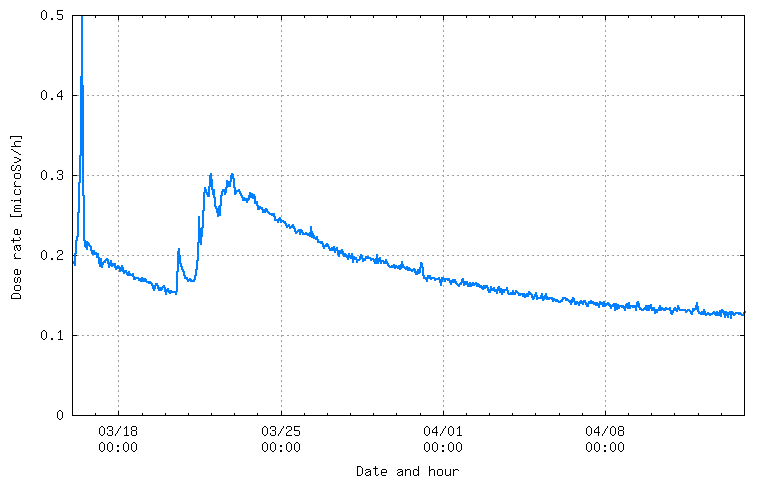
With regards to airborne radiation and ground measurement, here is the reading at the NaI detector at KEK in Tsukuba showing a steady decline over the past nine months. This was expected as the source became under  control over time.

I note that the mapping situation has readily improved over the past few months: see for instance this ground measurement map at Fukushima Dai-Chi plant and in the region surrounding it (via the Japan Radiation Map)

Sunday, April 3, 2011

Fukushima: Texas A&M forecasts, other simulations.

The Texas A&M forecasts are in:

Monday, April 4
 2011-04-04 12Z - forecast only
 2011-04-04 06Z - forecast only
 2011-04-04 00Z - forecast only


I also found some readings from KEK in Tokyo, that are similar but more frequently updated than the SPEED! measurements. They are here and here. As shown earlier, these measurements show several spikes stemming from the releases from the reactors and a larger set of bump starting around March 21st that seem to correlate with the pool cooling events. As soon as the pools are filled, i.e. cooled, the sources terms stops immediately.

At the start of the accidents, there was not much data with regards to the source term at Fukushima, i.e how much elements were escaping from the reactors. Most of the computations performed by different groups were focused on  a worst case scenario of continuous release, which was never supported by any of the SPEED! measurements. The simulations include:

  • Special Forecast products for Fukushima produced by NILU-ATMOS (disclaimer: These products are highly uncertain based on limited information for the source terms. Please use with caution and understand that the values are likely to change once we obtain more information on the overall nature of the accident. The products should be considered informational and only indicate 'worst case scenario' releases. From what we've learned recently, it seems releases of this magnitude have not yet occurred. Furthermore, these modeling products are based on global meteorological data, which are too coarse to provide reliable details of the transport of the plume across Japan.)
  • Eurad simulations. (Fukushima site) Disclaimer: This simulation is a so called "worst case scenario" with continuous release rate. The value of 0001 Bq / m 3 correspond to appr. one millionth of the concentration at the source. At distances more than appr. 2000 km away from the source, the concentrations are not harmful to health. The simulation starts at fictitious 15.03. 00 UTC and will continue to run in order to Demonstrate the InterContinental. Relaese exact transport When rates are published we will restart the simulation with reliable values.


When given more data from the CTBTO, the german Eurad model was re-run and the dispersion model was compared as to when CTBTO stations would detect the plume from the Fukushima plant. The animated gif is here.


and seems to show a pretty good fit with regards to when the stations would detect elements given the new simulations. Finally, an NOAA HYSPLIT model is currently being run by somebody which seems to give similar result with regards to particle trajectories. It is here

Friday, April 1, 2011

Fukushima: Combining information from UC Berkeley, Texas A&M and TEPCO.

There is a new report from UC Berkeley that provides a timeline of the radiation measurements. The report is here:

Of interest today is the peak observed on March 24th (California time = GMT - 9). If one checks the Texas A&M maps, it looks like there is a possibility to connect this peak to a source term around March 20th at around midnight (GMT) or a little bit before.


The TEPCO press release for that time frame show something new that day among other things:


Cooling of spent fuel pools At approximately 8:21 am, March 20th, water discharge to Unit 4 by fire engine has started with the cooperation of Self-Defense Forces.
Or because the graph shows counting performed for the whole day in California (as opposed to actual time period) another later event:


Cooling of Spent Fuel  From 3: 05 PM to 5: 20 PM on March 20th, 40 tons of seawater was injected into Unit 2 by TEPCO employees.


The finding seems consistent with any of two source terms occurring at 
  • 8:31 AM on March 20th, or about midnight March 20th (GMT) and,
  •  3:05PM/5:20PM on March 20th or about (6:00AM GMT March 20th).


 The detection in California has occurred around March 24th (PST) or about March 24th/March 25th (GMT).


Hence it becomes difficult to delineate which of the two source terms was effectively detected at Berkeley. Now let us watch the Tokyo measurements. it shows a start at about 8:00 am March 21st (JST)
which seems consistent with reactor #4 pool cooldown. The second peak seems connected to the reactor #2 cooldown but it could also be connected to the smoke observed on top of unit 3 (March 21), however that would seem unlikely since according to TEPCO environmental readings remained at the same level when the fumes occurred. Once the cooldown is obtained and stable, there is no expectation of further release to the environment. The expectation is now that the radiation measurements should continue decreasing (irrespective of whether the winds are westerly).

Tuesday, March 29, 2011

Fukushima: TAMU Forecasts March 30th, Source term around the plant.

The Texas A&M forecasts are in for tomorrow Wednesday March 30th:


Wednesday, March 30
  1.  2011-03-30 12Z - forecast only
  2.  2011-03-30 06Z - forecast only
  3.  2011-03-30 00Z - forecast only


Let us note that 06Z means 6:00 GMT or (6:00 + 9:00) 15:00 JST

From the IAEA press release:


Fukushima Daiichi Nuclear Accident Update (28 March, 23:00 UTC)

Japan Confirms Plutonium in Soil Samples at Fukushima Daiichi.After taking soil samples at the Fukushima Daiichi nuclear power plant, Japanese authorities today confirmed finding traces of plutonium that most likely resulted from the nuclear accident there. The Nuclear and Industrial Safety Agency told the IAEA that the Tokyo Electric Power Company (TEPCO) had found concentrations of plutonium in two of five soil samples.
Traces of plutonium are not uncommon in soil because they were deposited worldwide during the atmospheric nuclear testing era. However, the isotopic composition of the plutonium found at Fukushima Daiichi suggests the material came from the reactor site, according to TEPCO officials. Still, the quantity of plutonium found does not exceed background levels tracked by Japan's Ministry of Education, Culture, Sports, Science and Technology over the past 30 years.

It is important to realize that plutonium is already in the background in large part because of atomic weapons test performed in the 1950s and 1960s in the atmosphere. These tests released plumes of these materials in the atmosphere. The TEPCO/Fukushima anlysis shows specifically that these soil samples have elements of the reactors as the composition of fissile material is different from the atmospheric tests of the 50-60s. From  wikipedia, here is historical account on the truely known toxicity of Plutonium:

....Several populations of people who have been exposed to plutonium dust (e.g. people living down-wind of Nevada test sites, Hiroshima survivors, nuclear facility workers, and "terminally ill" patients injected with Pu in 1945–46 to study Pu metabolism) have been carefully followed and analyzed.
These studies generally do not show especially high plutonium toxicity or plutonium-induced cancer results.[88] "There were about 25 workers from Los Alamos National Laboratory who inhaled a considerable amount of plutonium dust during the 1940's; according to the hot-particle theory, each of them has a 99.5% chance of being dead from lung cancer by now, but there has not been a single lung cancer among them."[94][95]...

Sunday, March 20, 2011

Fukushima: Measured amount of iodine and cesium in atmosphere in Setagaya ku, Tokyo | 東京都世田谷区内で計測された大気中のヨウ素及びセシウム素

The following page reports on a day to day basis levels of iodine 131, iodine 132, cesium 134 and cesium 137 as measured in the atmosphere in Setagaya ku, in Tokyo. The documents are in Japanese, but spreadsheets should be understandable.

http://www.sangyo-rodo.metro.tokyo.jp/whats-new/measurement.html


Afficher Fukushima Plume (Sensors and Measurements) sur une carte plus grande