Showing posts with label simulation. Show all posts

Monday, April 4, 2011

Fukushima: Texas A&M forecasts for April 5th

The Texas A&M Forecasts are in and they are aiming westerly:


Tuesday, April 5
  1.  2011-04-05 12Z - forecast only
  2.  2011-04-05 06Z - forecast only
  3.  2011-04-05 00Z - forecast only

Sunday, April 3, 2011

Fukushima: Texas A&M forecasts, other simulations.

The Texas A&M forecasts are in:

Monday, April 4
 2011-04-04 12Z - forecast only
 2011-04-04 06Z - forecast only
 2011-04-04 00Z - forecast only


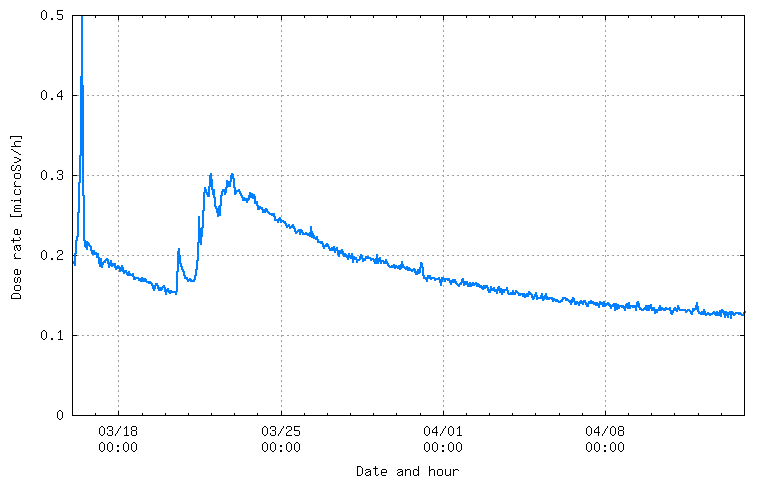
I also found some readings from KEK in Tokyo, that are similar but more frequently updated than the SPEED! measurements. They are here and here. As shown earlier, these measurements show several spikes stemming from the releases from the reactors and a larger set of bump starting around March 21st that seem to correlate with the pool cooling events. As soon as the pools are filled, i.e. cooled, the sources terms stops immediately.

At the start of the accidents, there was not much data with regards to the source term at Fukushima, i.e how much elements were escaping from the reactors. Most of the computations performed by different groups were focused on  a worst case scenario of continuous release, which was never supported by any of the SPEED! measurements. The simulations include:

  • Special Forecast products for Fukushima produced by NILU-ATMOS (disclaimer: These products are highly uncertain based on limited information for the source terms. Please use with caution and understand that the values are likely to change once we obtain more information on the overall nature of the accident. The products should be considered informational and only indicate 'worst case scenario' releases. From what we've learned recently, it seems releases of this magnitude have not yet occurred. Furthermore, these modeling products are based on global meteorological data, which are too coarse to provide reliable details of the transport of the plume across Japan.)
  • Eurad simulations. (Fukushima site) Disclaimer: This simulation is a so called "worst case scenario" with continuous release rate. The value of 0001 Bq / m 3 correspond to appr. one millionth of the concentration at the source. At distances more than appr. 2000 km away from the source, the concentrations are not harmful to health. The simulation starts at fictitious 15.03. 00 UTC and will continue to run in order to Demonstrate the InterContinental. Relaese exact transport When rates are published we will restart the simulation with reliable values.


When given more data from the CTBTO, the german Eurad model was re-run and the dispersion model was compared as to when CTBTO stations would detect the plume from the Fukushima plant. The animated gif is here.


and seems to show a pretty good fit with regards to when the stations would detect elements given the new simulations. Finally, an NOAA HYSPLIT model is currently being run by somebody which seems to give similar result with regards to particle trajectories. It is here

Saturday, April 2, 2011

Fukushima: Texas A&M Forecasts for April 3rd

The Texas A&M prediction maps for April 3rd are in:


Sunday, April 3
 2011-04-03 12Z - forecast only
 2011-04-03 06Z - forecast only
 2011-04-03 00Z - forecast only
Saturday, April 2
 2011-04-02 18Z - forecast only
 2011-04-02 12Z - forecast only
 2011-04-02 06Z - forecast only
 2011-04-02 00Z - forecast only

Looks there is a chance for some radiation monitoring station in Taiwan and South Korea to pick up similar radiation patterns as those detected by University of Washington and UC Berkeley (i.e. barely detectable, very low level). Cheryl Rofer has an entry on bits and pieces related to the Fukushima accident. Of interest is the entry on what we know with regards to radiation effect on people.

Tuesday, March 29, 2011

Fukushima: TAMU Forecasts March 30th, Source term around the plant.

The Texas A&M forecasts are in for tomorrow Wednesday March 30th:


Wednesday, March 30
  1.  2011-03-30 12Z - forecast only
  2.  2011-03-30 06Z - forecast only
  3.  2011-03-30 00Z - forecast only


Let us note that 06Z means 6:00 GMT or (6:00 + 9:00) 15:00 JST

From the IAEA press release:


Fukushima Daiichi Nuclear Accident Update (28 March, 23:00 UTC)

Japan Confirms Plutonium in Soil Samples at Fukushima Daiichi.After taking soil samples at the Fukushima Daiichi nuclear power plant, Japanese authorities today confirmed finding traces of plutonium that most likely resulted from the nuclear accident there. The Nuclear and Industrial Safety Agency told the IAEA that the Tokyo Electric Power Company (TEPCO) had found concentrations of plutonium in two of five soil samples.
Traces of plutonium are not uncommon in soil because they were deposited worldwide during the atmospheric nuclear testing era. However, the isotopic composition of the plutonium found at Fukushima Daiichi suggests the material came from the reactor site, according to TEPCO officials. Still, the quantity of plutonium found does not exceed background levels tracked by Japan's Ministry of Education, Culture, Sports, Science and Technology over the past 30 years.

It is important to realize that plutonium is already in the background in large part because of atomic weapons test performed in the 1950s and 1960s in the atmosphere. These tests released plumes of these materials in the atmosphere. The TEPCO/Fukushima anlysis shows specifically that these soil samples have elements of the reactors as the composition of fissile material is different from the atmospheric tests of the 50-60s. From  wikipedia, here is historical account on the truely known toxicity of Plutonium:

....Several populations of people who have been exposed to plutonium dust (e.g. people living down-wind of Nevada test sites, Hiroshima survivors, nuclear facility workers, and "terminally ill" patients injected with Pu in 1945–46 to study Pu metabolism) have been carefully followed and analyzed.
These studies generally do not show especially high plutonium toxicity or plutonium-induced cancer results.[88] "There were about 25 workers from Los Alamos National Laboratory who inhaled a considerable amount of plutonium dust during the 1940's; according to the hot-particle theory, each of them has a 99.5% chance of being dead from lung cancer by now, but there has not been a single lung cancer among them."[94][95]...

Monday, March 28, 2011

Fukushima: TAMU Forecasts Tuesday March 29, a note on the TAMU model, Microsievert.net

Texas A&M Forecasts and status updates are in;


Tuesday, March 29
  1.  2011-03-29 12Z - forecast only
  2.  2011-03-29 06Z - forecast only
  3.  2011-03-29 00Z - forecast only

I have had a small exchange with Dr. Ken Bowman on the model used for these simulations:

Dear Igor,

... I finally found a little time to look at your blog. I like the way that you are bringing things together.

The model that I am running is good for giving a general idea of where a release might go on the large scale. The resolution of the global winds is about 50 km. At that resolution, the model does a poor job of representing the mountainous topography of Japan. My maps should not be called an 'aerosol simulation', as they have no aerosol physics in them, just passive advection by the winds....

Thanks Ken.

Finally, microsioevert.net is a new site featuring a different kind of vizualisation than we have been accustomed to,

Sunday, March 27, 2011

Fukushima: Texas A&M Forecasts Mon March 28, Plume detection in France and other countries, Radiation Measurements and Standards

The Texas A&M forecasts are in:
Monday, March 28
 2011-03-28 12Z - forecast only
 2011-03-28 06Z - forecast only
 2011-03-28 00Z - forecast only

And it looks like the winds are going westerly. In other news, the French Teleray radiation sensor network has detected the plume in metropolitan France. All measurements show that the plume is in the background. The following graph show radiation level average over a month and radiation level for the plume:


Of interest is a summary of what was found in other countries:

Measurement results were published in the United States by the protection agency(EPA - http://www.epa.gov/japan2011/). They show small traces of radioactive products released during the Fukushima accident, were detected on filters as atmospheric dust samples in California (San Francisco, Riverside, Anaheim) and in the state of Washington (Seattle) on the west coast. Radionuclides are identified 131, tellurium 132, iodine 132 and cesium 137. Concentrations measured on March 18 for those elements are a few tenths of a mBq / m3 or lower. In Scandinavia, iodine 131 was measured in air in Stockholm, Umeå and Kiruna (Sweden) at a concentration of less than 0.30 mBq / m3, in Finland (less than 1 mBq / m3), Germany (0.33 mBq / m3 for all artificial radionuclides detected) for samples performed between 22 and 23 March. In the Netherlands, iodine was also detected in air: a concentration of 0.17 mBq / m3. These results are consistent, in terms of date and order of magnitude, with forecasts performed by Météo France at the global level, in collaboration with IRSN. They confirm particularly in Europe, the dispersed radioactive elements came from the north, as provided for the modeling of Météo France.
The press releases are here: number 3 and 4.

Chreyl Rofer has two blog entries of interest with regards to radiation measurements and exposure.

Saturday, March 26, 2011

Fukushima: Texas A&M Forecasts Sun March 27, Air Share, Comments on Source Term

The Texas A&M predictions just came out:

Sunday, March 27
 2011-03-27 12Z - forecast only
 2011-03-27 06Z - forecast only
 2011-03-27 00Z - forecast only

The Google Maps Mania blog pointed out to another instance of trajectory computation called Shared Air by the folks at University of Michigan. In these maps, you choose a city in Japan and figure out if the winds and particle came from Fukushima. It really is the reverse problem that the Texas A&M computations do.


Cheryl Rofer has a series of blog entries of interest to plume:

Is There a Leak at Fukushima #3?
And Now...Becquerels!
If You're Anywhere But Japan, Don't Take Potassium Iodide!

Frank Munger mentions the fact that Oak Ridge National Lab (ORNL) is providing computational suport to DOE on the modeling of what is currently going on in each of the reactors and pools.

Friday, March 25, 2011

Fukushima: Texas A&M Forecasts Sat March 25, A Challenge ?, Other assessments and radiation monitoring networks

The Texas A&M forecasts are in for tomorrow:
Saturday, March 26
 2011-03-26 12Z - forecast only
 2011-03-26 06Z - forecast only
 2011-03-26 00Z - forecast only

If the trend is correct, the plume is likely to be conveyed away from Japanese land for tomorrow. It also shows the plume aiming for the Philippines. If the plume is the same as it has been for the past week as it spread to the US, it will not yield appreciable dose. Ken Bowman, the initiator of the Texas A&M simulations let me know that I should not use the term aerosol simulation for his simulations "as they have no aerosol physics in them, just passive advection by the winds.". Thanks Ken for the correction.

I am wondering if we should not have some type of challenge that would ask people to show side by side  how simulations and sensor networks measurements could be compared. 

The DOE site about the situation in Japan is here. While they have provided data on the ground from their assessment team, I have not seen any result from plume simulations from their center at Livermore. Of interest is the mention in USA Today of an assessment performed by some IAEA/Japan team around Fukushima. I am not sure I have seen these results on the web.


In the meantime, I have come across two country-wide maps of interest for generic radiation sensor network monitoring who are seemingly not affected by the Fukushima plume.

Tuesday, March 22, 2011

Fukushima: Texas A&M simulation vs ground measurements

One of the "raison d'etre" of this blog is to compare ground measurements from government or citizen sensor networks and the diverse computational simulations used to model man made or natural plumes. While the French ISRN has performed some computations, its own sensor network is likely to not going to be able to pick up the radiation as it is likely to be in the background when it reaches metropolitan France. At Texas A&M,   Kenneth Bowman, Cameron  Homeyer have continued providing computation of the transport of aerosols from the Fukushima plant. How do these computations compare with the readings from the different government owned sensor networks ?. In particular, how do these measurements compare with the two events listed in the Texas A&M maps.?

The fire at Reactor 4 took place at 9:40 am March 15 JST (0:40 March 15 GMT) while the explosion of reactor 2 took place earlier at 6:10 a.m (21:10 March 14 GMT) that day (see here for references)


Tuesday, March 152011-03-15 00Z - analysis only (time of reported fire in reactor #4)

According to the trajectories, four ticks later (12 hours later) it is over Ibakari prefecture. The first peak is at 6 AM JST on March 16th (21:00 GMT March 15th). While the red tracks goes south, the green and blue stays over that prefecture and are a therefore consistent with the peak recorded there at 6AM JST (21 hours later). But that measurement is also consistent with the explosion at reactor #2.(24 hours later) as can be seen in the following map.


Monday, March 14  2011-03-14 21Z - analysis only (time of reported explosion in reactor #2)

So from a first reading of these maps, it does not look feasible to evaluate which of these two accidents is contributing to the measurements on the ground. Let us also not that the days after may 16, 17, the aerosols went over the pacific ocean.thereby reducing the dose to the land.

Saturday, March 19, 2011

Fukushima: French ISRN and Texas A&M Simulation of Fukushima plume from March 12 to March 22: Tokyo and Global scale

Today, the French ISRN released some results of its computation of the Fukushima plume over Tokyo. Another simulation shows the plume till March 25th for the whole Globe taking into consideration data from the French meteorological office. 


2 - The dispersion of radioactive releases into the atmosphere
IRSN simulated atmospheric dispersion of releases estimated between 12 and 22 March, using its numerical model applicable to long distance (scale of several hundred kilometers), using observations and weather forecasts provided by Weather France.
This simulation was applied to the cesium 137, as a tracer of the plume during this period. The modeling results are expressed in becquerels of cesium-137 per cubic meter of air (Bq / m 3).
Watch the simulation of the plume
This modeling performed throughout Japan shows that the plume has led in directions that have varied over time: first north-east until March 14, then south and southeast west toward Tokyo, March 15, then east toward the Pacific Ocean.
IRSN compared the simulation results with the results of measurements of air contamination carried in Tokyo. They are the same order of magnitude as the values ​​measured in this city, as shown in the charts below for iodine 131 and cesium 137.
This comparison allows us to consider that the air dispersion modeling performed by IRSN to produce satisfactory results for the agglomeration of Tokyo and the doses calculated by IRSN from this modeling are representative of the doses may have been received by the population exposed to the radioactive plume.


and then for the whole globe:


4 - Modeling the dispersion of radioactive releases into the atmosphere on a global scale
From the estimated releases from IRSN, Meteo France has simulated the dispersion of radioactive releases from great distances, projected until March 26.
visionner la simulation

Watch the simulation

According to this simulation, the plume would now reached the north-eastern Siberia, the United States and western Atlantic. It should reach France from 23 or 24 March.
Merger expected to run from this model could be of the order of 0,001 Bq / m 3 in France and the overseas departments of the northern hemisphere. As expected, the southern hemisphere is not significantly affected by this large-scale dispersal.
For comparison, values ​​measured in the days following the Chernobyl accident had exceeded 100 000 Bq / m 3 in the first few kilometers around the plant and they were in the range of 100 to 1000 Bq / m 3 in the country most affected by the plume (Ukraine, Belarus); France, values ​​measured in the east were the order of 1 to 10 Bq/m3 (May 1, 1986). Today, a very low activity of cesium-137 remains in the air, on the order of 0.000001 Bq/m3.

To give some perspective, as per wikipedia, one Bq is defined as the activity of a quantity of radioactive material in which one nucleus decays per second.. From the TORCH report on how to computer the dose due to Cesium from its Bequerel units::


To sum these properties up
  • The dose rate due to external irradiation from uniform contamination of the ground by 137Cs is 1.6 x 10⁻¹² Sv hr-1 Bq-1 m2.
  • The internal dose for ingestion is 1.2 x 10⁻⁸ Sv Bq-1
  • The internal dose for inhalation is 8.7 x 10⁻⁹ Sv Bq-1

The maximum for this global computation is 1000 Bq/m^3. All other colors are decreasing by increment of ten from that maximum. This number has then to be multiplied by the low numbers above to obtain a dose. As can be seen from the US EPA detectors, this dose is part of the background radiation level. Another map of interest shows that the plume modeling is different for different  research teams. The folks at Texas A&M provide computations showing particles in the plume flying at 2 to 4 km altitude while the french model is restricted to 500m high.


Friday, March 18, 2011

Fukushima: Estimates of potential exposures in Fukushima area

[ Update: Cheryl Rofer provides some context to this NYT map in NRC Webcast Monday and How Not To Do Modeling]
The NY Times has published a map of the estimated potential exposures around Fukushima area from a simulation, along with expected symptoms of exposure to those levels. Also listed is the population living in those area before the earthquake. From the site:

The American Embassy recommended on Wednesday that Americans within 50 miles of the Fukushima reactors evacuate, based on an analysis by the Nuclear Regulartory Commission. The recommendation was based on a model that predicts potential radiation levels depending on whether the containment vessels remain intact, weather patterns, and other factors. Here are the results of the model on March 16.


NY Times新聞は以下の記事で、福島の近くの予測地図があります:地震まえの人口密度、放射線、症候。

http://www.nytimes.com/interactive/2011/03/16/world/asia/japan-nuclear-evaculation-zone.html


Mentioned sources:
Nuclear Regulatory Commission;
Environmental Protection Agency;
Robert Meck, health physicist, Science and Technology Systems;
LandScan 2009 population dataset/UT-Battelle (population estimates)

Fukushima: Simulations of atmospheric dispersion of the plume formed by the release of the Fukushima Daiichi Nuclear Power Station, between March 12 and March 20, 2011

From the French Radiation Protection Agency:


1 - What is known radioactive releases issued at March 12, 2011 then?

The IRSN has no direct information on the composition and extent of radioactive releases. The interpretation of dose rate measurements on site and the likely scenarios of degradation of three reactors since March 12, assuming that these releases will continue until 20 March. The radioactive elements released during various episodes of rejection are rare gases (radioactive elements chemically unreactive, remaining in the atmosphere without being deposited on the ground) and volatile elements, mainly from radioactive iodine, including iodine-131 which has a half life of 8 days, and radioactive cesium, which cesium 137. The proportions of the different radioactive elements into account general knowledge about nuclear reactors. 
2 - The dispersion of radioactive releases into the atmosphere

IRSN simulated atmospheric dispersion of releases estimated between 12 and 20 March, using its numerical model applicable to long distance (scale of several hundred kilometers), using weather forecasts provided by Météo France .
This simulation was applied to the cesium 137, as a tracer of the plume during this period. The results of this simulation, conducted every hour from 12 March, are expressed in becquerels of cesium-137 per cubic meter of air (Bq / m 3). For comparison, values ​​measured near the Chernobyl plant, shortly after the accident on April 26, 1986, exceeded 100 000 Bq / m; they were in the range of 100-1000 Bq / m 3 in the country most affected by the plume (Ukraine, Belarus); France, values ​​measured in the east were the order of 1 to 10 Bq/m3 (May 1, 1986).
Today, a very low activity of cesium-137 remains in the air, on the order of 0.000001 Bq/m3.

3 - Estimation of doses likely to be received by persons exposed to the radioactive plume

IRSN said the doses likely to be received by a person exposed to the radioactive plume, assuming it stays in one place and unprotected (outside) for the duration of discards (from March 12 to 20 ). For these dose calculations, the SNRIs considered a child of a year which is most sensitive to iodine 131 (thyroid dose). It is therefore prudent assumptions.
The following simulations show the evolution of doses over time, the simulation period. If no new discharges would occur in the future, these rates may increase further in the absence of protection for those most at risk.
Whole body dose may be received by a child of 1 year in the absence of protection for releases


In case of accident, the dose values ​​from which protective actions are recommended are 10 mSv for sheltering in place and 50 mSv for evacuation. Below 10 mSv, the health risk is considered low enough not to make the necessary protective actions. For comparison, the average annual dose received in France due to natural radioactivity and medical exposure is 3.7 mSv.

Thyroid doses could be received by a child of 1 year in the absence of protection for releases  


In case of accident, the dose values ​​from which the ingestion of stable iodine is recommended is 100 mSv in Japan.