Showing posts with label measurement. Show all posts

Wednesday, December 28, 2011

Fukushima: 9 Months later

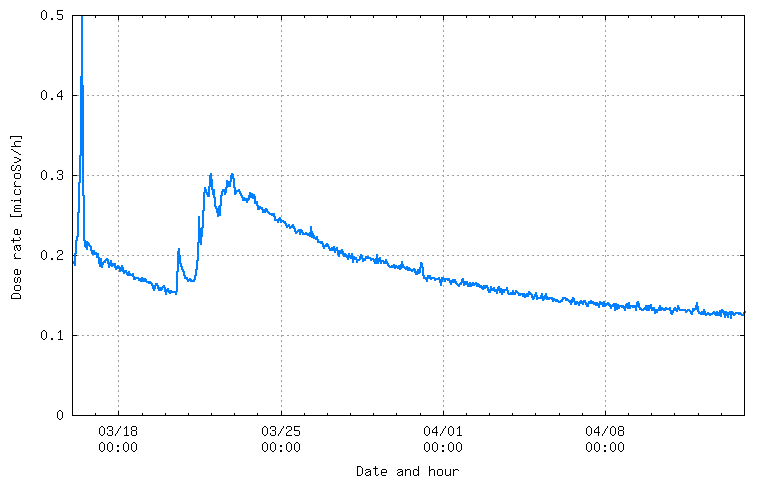
With regards to airborne radiation and ground measurement, here is the reading at the NaI detector at KEK in Tsukuba showing a steady decline over the past nine months. This was expected as the source became under  control over time.

I note that the mapping situation has readily improved over the past few months: see for instance this ground measurement map at Fukushima Dai-Chi plant and in the region surrounding it (via the Japan Radiation Map)

Sunday, April 3, 2011

Fukushima: Texas A&M forecasts, other simulations.

The Texas A&M forecasts are in:

Monday, April 4
 2011-04-04 12Z - forecast only
 2011-04-04 06Z - forecast only
 2011-04-04 00Z - forecast only


I also found some readings from KEK in Tokyo, that are similar but more frequently updated than the SPEED! measurements. They are here and here. As shown earlier, these measurements show several spikes stemming from the releases from the reactors and a larger set of bump starting around March 21st that seem to correlate with the pool cooling events. As soon as the pools are filled, i.e. cooled, the sources terms stops immediately.

At the start of the accidents, there was not much data with regards to the source term at Fukushima, i.e how much elements were escaping from the reactors. Most of the computations performed by different groups were focused on  a worst case scenario of continuous release, which was never supported by any of the SPEED! measurements. The simulations include:

  • Special Forecast products for Fukushima produced by NILU-ATMOS (disclaimer: These products are highly uncertain based on limited information for the source terms. Please use with caution and understand that the values are likely to change once we obtain more information on the overall nature of the accident. The products should be considered informational and only indicate 'worst case scenario' releases. From what we've learned recently, it seems releases of this magnitude have not yet occurred. Furthermore, these modeling products are based on global meteorological data, which are too coarse to provide reliable details of the transport of the plume across Japan.)
  • Eurad simulations. (Fukushima site) Disclaimer: This simulation is a so called "worst case scenario" with continuous release rate. The value of 0001 Bq / m 3 correspond to appr. one millionth of the concentration at the source. At distances more than appr. 2000 km away from the source, the concentrations are not harmful to health. The simulation starts at fictitious 15.03. 00 UTC and will continue to run in order to Demonstrate the InterContinental. Relaese exact transport When rates are published we will restart the simulation with reliable values.


When given more data from the CTBTO, the german Eurad model was re-run and the dispersion model was compared as to when CTBTO stations would detect the plume from the Fukushima plant. The animated gif is here.


and seems to show a pretty good fit with regards to when the stations would detect elements given the new simulations. Finally, an NOAA HYSPLIT model is currently being run by somebody which seems to give similar result with regards to particle trajectories. It is here

Saturday, April 2, 2011

Fukushima: Texas A&M Forecasts for April 3rd

The Texas A&M prediction maps for April 3rd are in:


Sunday, April 3
 2011-04-03 12Z - forecast only
 2011-04-03 06Z - forecast only
 2011-04-03 00Z - forecast only
Saturday, April 2
 2011-04-02 18Z - forecast only
 2011-04-02 12Z - forecast only
 2011-04-02 06Z - forecast only
 2011-04-02 00Z - forecast only

Looks there is a chance for some radiation monitoring station in Taiwan and South Korea to pick up similar radiation patterns as those detected by University of Washington and UC Berkeley (i.e. barely detectable, very low level). Cheryl Rofer has an entry on bits and pieces related to the Fukushima accident. Of interest is the entry on what we know with regards to radiation effect on people.

Thursday, March 31, 2011

Fukushima: Ibakari Analysis for March 21st.

I wanted to come back to an dose rate increase in Ibakari that occurred on March 21st at 10:00 am. From here:

According to the TEPCO press release on March 20th, the only event I could find is the cooling of the spent fuel of reactor 2:

Cooling of Spent FuelFrom 3: 05 PM to 5: 20 PM on March 20th, 40 tons of seawater was injected into Unit 2 by TEPCO employees.

On the 22th, at 21:00 JST on March 22, there is a drop, that coincides with a westerly wind. Then the dose rate goes up as the winds comes back to the Ibakari region. So it looks like from the information currently available, the cooling of the pool in reactor 2 and attendant vapor generation might be responsible for this increase in dose rate in Ibakari.

Wednesday, March 30, 2011

Fukushima: TAMU Forecast March 31st, Analysis for Ibakari

The Texas A&M prediction maps for tomorrow are in:


Thursday, March 31
  1.  2011-03-31 12Z - forecast only
  2.  2011-03-31 06Z - forecast only
  3.  2011-03-31 00Z - forecast only

Please note that 06Z means 6:00 GMT or (6:00 + 9:00) 15:00 JST.

Yesterday, the prediction showed some trajectories going in the direction of Ibakari. Yesterday's map of the  region showed:


 Today's readings show the following map:

At first, there is no obvious difference using the color coding of that map. The historical charts in the same region show the following trend:

or a tiny increase of less than 0.2 microSv/hr at Takahagi. The map from Texas A&M is the one dated March 29th at 18 GMT or March 30 03:00 JST:


Sunday, March 27, 2011

Fukushima: Texas A&M Forecasts Mon March 28, Plume detection in France and other countries, Radiation Measurements and Standards

The Texas A&M forecasts are in:
Monday, March 28
 2011-03-28 12Z - forecast only
 2011-03-28 06Z - forecast only
 2011-03-28 00Z - forecast only

And it looks like the winds are going westerly. In other news, the French Teleray radiation sensor network has detected the plume in metropolitan France. All measurements show that the plume is in the background. The following graph show radiation level average over a month and radiation level for the plume:


Of interest is a summary of what was found in other countries:

Measurement results were published in the United States by the protection agency(EPA - http://www.epa.gov/japan2011/). They show small traces of radioactive products released during the Fukushima accident, were detected on filters as atmospheric dust samples in California (San Francisco, Riverside, Anaheim) and in the state of Washington (Seattle) on the west coast. Radionuclides are identified 131, tellurium 132, iodine 132 and cesium 137. Concentrations measured on March 18 for those elements are a few tenths of a mBq / m3 or lower. In Scandinavia, iodine 131 was measured in air in Stockholm, Umeå and Kiruna (Sweden) at a concentration of less than 0.30 mBq / m3, in Finland (less than 1 mBq / m3), Germany (0.33 mBq / m3 for all artificial radionuclides detected) for samples performed between 22 and 23 March. In the Netherlands, iodine was also detected in air: a concentration of 0.17 mBq / m3. These results are consistent, in terms of date and order of magnitude, with forecasts performed by Météo France at the global level, in collaboration with IRSN. They confirm particularly in Europe, the dispersed radioactive elements came from the north, as provided for the modeling of Météo France.
The press releases are here: number 3 and 4.

Chreyl Rofer has two blog entries of interest with regards to radiation measurements and exposure.

Friday, March 25, 2011

Fukushima: Source Term Analysis in Seattle. Potential understanding of Unit 3 fumes.

[Update: The folks at the Unversity of Washington are now aware of this opportunity]

The arxiv blog just featured a paper that appeared on arxiv that points to an analysis of the plume that landed at the University of Washington in Seattle. The paper is at the end of this entry. A good summary is here, from the text:
Finally, there are a huge number of possible breakdown products from nuclear fission in a reactor and yet the Seattle team found evidence of only three fission product elements--iodine, cesium and tellurium. "This points to a specifific process of release into the atmosphere," they say.

Cesium Iodide is highly soluble in water. So these guys speculate that what they're seeing is the result of contaminated steam being released into the atmosphere. "Chernobyl debris, conversely, showed a much broader spectrum of elements, reflecting the direct dispersal of active fuel elements," they say.

If one checks the Texas A&M predictions, arrival in Seattle on March 17-18 can be assumed thanks to this map that assumes ejection around 12 GMT on March 13th (or 21 JST March 13th)


This would correspond to an event in Unit 3 according to this map.

The folks at University of Washington ought to be looking at the Texas A&M simulations to see if and when they are going to catch up elements of the plumes.

Unit 3 is still a concern today as an analysis of the water outside of the secondary containment has shown elements such as Technetium-99m (Thanks David).

To see if the plume contains some of these elements, we ought to be looking at the smoke that left unit 3. As per TEPCO's report:

At approximately 4:00 pm, March 21st, light gray smoke was confirmed arising from the floor roof of the Unit 3 building. On March 22nd, the color of smoke changed to somewhat white and it is slowly dissipating.
-At approximately 10:45 pm on March 22nd, the light in the main control room was turned on.
-At around 4:20 pm on March 23rd, our staff confirmed light black smoke belching from the Unit 3 building. At approximately 11:30 pm on March 23rd and 4:50 am on March 24th, our employee found no signs of smoke.

If one converts these dates from JST to GMT, we have:

7:00 am GMT March 21st: light gray smoke
7:20 am March 23rd: light black smoke

A simulation for the March 21st event was performed for 6:00 am and it shows that plume hitting Seattle tomorrow.


A simulation for the second event does not seem as conclusive.


The paper: Arrival time and magnitude of airborne fission products from the Fukushima, Japan, reactor incident as measured in Seattle, WA, USA by J. Diaz Leon, J. Kaspar, A. Knecht, M. L. Miller, R. G. H. Robertson, A. G. Schubert. The abstract reads:
We report results of air monitoring started due to the recent natural catastrophe on March 11, 2011 in Japan and the severe ensuing damage to the Fukushima nuclear reactor complex. On March 17-18, 2011 we detected the first arrival of the airborne fission products 131-I, 132-I, 132-Te, 134-Cs, and 137-Cs in Seattle, WA, USA, by identifying their characteristic gamma rays using a germanium detector. The highest detected activity to date is less than 32 mBq/m^3 of 131-I.

Fukushima: Texas A&M Forecasts Sat March 25, A Challenge ?, Other assessments and radiation monitoring networks

The Texas A&M forecasts are in for tomorrow:
Saturday, March 26
 2011-03-26 12Z - forecast only
 2011-03-26 06Z - forecast only
 2011-03-26 00Z - forecast only

If the trend is correct, the plume is likely to be conveyed away from Japanese land for tomorrow. It also shows the plume aiming for the Philippines. If the plume is the same as it has been for the past week as it spread to the US, it will not yield appreciable dose. Ken Bowman, the initiator of the Texas A&M simulations let me know that I should not use the term aerosol simulation for his simulations "as they have no aerosol physics in them, just passive advection by the winds.". Thanks Ken for the correction.

I am wondering if we should not have some type of challenge that would ask people to show side by side  how simulations and sensor networks measurements could be compared. 

The DOE site about the situation in Japan is here. While they have provided data on the ground from their assessment team, I have not seen any result from plume simulations from their center at Livermore. Of interest is the mention in USA Today of an assessment performed by some IAEA/Japan team around Fukushima. I am not sure I have seen these results on the web.


In the meantime, I have come across two country-wide maps of interest for generic radiation sensor network monitoring who are seemingly not affected by the Fukushima plume.

Wednesday, March 23, 2011

Fukushima: U.S. Department of Energy Aerial and Ground Monitoring Data

The U.S Department of Energy just issued a press release and a presentation that featured aerial and ground measurement data. In the presentation there is also a mention of a ground US monitoring station deployed by their Consequence Management Response Teams near Fukushima. (Download the presentation here)


Fukushima: Levels of radioactive iodine and cesium in tap water

The Japanese Ministry of Education, Culture, Sport, Science and Technology (MEXT), which has published charts we already referenced here (they are now available from our map) of the levels of radiation measured in all prefectures, also published charts of the levels of radioactive iodine 131 and cesium 137 measured in tap water.

Those charts are gathered on this page (link to the source is available).

Tuesday, March 22, 2011

Fukushima: Texas A&M simulation vs ground measurements

One of the "raison d'etre" of this blog is to compare ground measurements from government or citizen sensor networks and the diverse computational simulations used to model man made or natural plumes. While the French ISRN has performed some computations, its own sensor network is likely to not going to be able to pick up the radiation as it is likely to be in the background when it reaches metropolitan France. At Texas A&M,   Kenneth Bowman, Cameron  Homeyer have continued providing computation of the transport of aerosols from the Fukushima plant. How do these computations compare with the readings from the different government owned sensor networks ?. In particular, how do these measurements compare with the two events listed in the Texas A&M maps.?

The fire at Reactor 4 took place at 9:40 am March 15 JST (0:40 March 15 GMT) while the explosion of reactor 2 took place earlier at 6:10 a.m (21:10 March 14 GMT) that day (see here for references)


Tuesday, March 152011-03-15 00Z - analysis only (time of reported fire in reactor #4)

According to the trajectories, four ticks later (12 hours later) it is over Ibakari prefecture. The first peak is at 6 AM JST on March 16th (21:00 GMT March 15th). While the red tracks goes south, the green and blue stays over that prefecture and are a therefore consistent with the peak recorded there at 6AM JST (21 hours later). But that measurement is also consistent with the explosion at reactor #2.(24 hours later) as can be seen in the following map.


Monday, March 14  2011-03-14 21Z - analysis only (time of reported explosion in reactor #2)

So from a first reading of these maps, it does not look feasible to evaluate which of these two accidents is contributing to the measurements on the ground. Let us also not that the days after may 16, 17, the aerosols went over the pacific ocean.thereby reducing the dose to the land.

Monday, March 21, 2011

Fukushima: New plumes, SPEED measurements and Cs and I measurements in Tokyo.

So far today, there have been reports of produce contamination in he Ibakari prefecture and the fact that two plumes formed and were the reasons for the evacuation of workers at Fukushima. One should note that the detector at Fukushima are not being given in the SPEED network and so we get to see only readings further away from the plume source. As one can see from the report above,  there have an increase in the dose rate on March 21 in the Ikabari prefecture. A similar trend can be found in the detection performed for Cesium 137, Cesium 134, iodine 132 and iodine 131 performed in Tokyo. From the data [1], one can categorize the following days with background level measurements: March 17March 18  March 19,  March 20 while March 15March 16March 21 show much larger contributions. We should remain with an above average contribution for March 22. 

The background levels are estimated by comparing the values to the background values at UCBerkeley. Let us note that these measurements are extracted because each of these elements have a specific gamma signature. Geiger counters being considered for monitoring the plume do not detect the same thing. In particular, in Geiger counters, there is no discrimination in energy.


If we take the measurements of the SPEED network for Hairando (south of Tokyo), the jump seen in the Cesium and Iodine measurement above do not show up on that network's measurement in the same area (Tokyo).


This maybe an issue of wind patterns. One can also regret that while there are a few models looking into the plume displacement over the whole globe, there seems to be scant simulation focused only on Japan.


[1] Source: Department of Health and Welfare, Tokyo

Sunday, March 20, 2011

Fukushima: Measured amount of iodine and cesium in atmosphere in Setagaya ku, Tokyo | 東京都世田谷区内で計測された大気中のヨウ素及びセシウム素

The following page reports on a day to day basis levels of iodine 131, iodine 132, cesium 134 and cesium 137 as measured in the atmosphere in Setagaya ku, in Tokyo. The documents are in Japanese, but spreadsheets should be understandable.

http://www.sangyo-rodo.metro.tokyo.jp/whats-new/measurement.html


Afficher Fukushima Plume (Sensors and Measurements) sur une carte plus grande

Saturday, March 19, 2011

Fukushima: Taiwan Real Time Radiation Monitoring Data / No realtime data from Radiation Monitoring Network in Canada, Korea, China

The Taiwan Radiation Monitoring Center offers real-time radiation data.


No real time data can be found for the following countries:

Fukushima: U.S. EPA Radiation Monitoring Network, Japanese Nuclear Emergency:Page

The United States Environmental Protection Agency has a network of radiation monitoring stations all over the country. They have set up a page entitled Japanese Nuclear Emergency: Basic Radiation Facts From EPA. By clicking through several menus items one can get directly to:

Radiation Air Monitoring Data


The current readings in Southern california can be found here. The google maps version is here.


Friday, March 18, 2011

Fukushima: Japanese Disaster Prevention and Nuclear Safety Network for Nuclear Environment

There is a realtime radiation data collected via the System for Prediction of Environment Emergency Dose Information(SPEEDI) and provided in a map. Let us note that the dose rate units are in nGy/hr. The unit Gy stands for Gray, a unit that cannot be translated directly to Sievert. From Wikipedia:
Although the sievert has the same dimensions as the gray (i.e. joules per kilogram), it measures a different quantity. To avoid confusion between the absorbed dose and the equivalent dose, the corresponding special units, namely the gray for absorbed dose and the sievert for the dose equivalent, are used. For a given amount of radiation (measured in gray - the plural of gray is gray), the biological effect (measured in sievert) can vary considerably as a result of the radiation weighting factor WR. This variation in effect is attributed to the Linear Energy Transfer [LET] of the type of radiation, creating a different relative biological effectiveness for each type of radiation under consideration. Per most government regulations, the RBE [Q] for electron and photon radiation is 1, and varies for other types of radiation (see Q value).

The Q-value can vary from 1 to 20 depending on the radiation being released in the atmosphere. The Q-value on Wikipedia has the following:
Here are some quality factor values based on ICRP 103 recommendations:[15]
Photons, all energies : Q = 1
Electrons and muons, all energies : Q = 1
Protons and charged pions : Q = 2
Neutrons : Q is a continuous function of neutron energy
Alpha particles and other atomic nuclei : Q = 20
Here is the site in Japanese.

Fukushima: Geiger counter in Minato ku, Tokyo

The following web page reports dose equivalent measures in Minato ku, in downtown Tokyo.

http://www.denphone.com/denphone-tokyo-office-geiger-counter


Afficher Fukushima Plume (Sensors and Measurements) sur une carte plus grande

Fukushima: GM detector in Tsukuba, Ibaraki prefecture

The following web page reports dose equivalent measures in Tsukuba. The page is both in English and Japanese.

このウェブページで最近のつくば市にある等価線量を読めます。

http://rcwww.kek.jp/norm/


Afficher Fukushima Plume (Sensors and Measurements) sur une carte plus grande

Fukushima: Radiation dosage readings from the radiation monitoring posts at RIKEN Wako Institute

Radiation dose rate readings at RIKEN in Tokyo.

Fukushima: A Geiger meter in Chiba prefecture | 千葉県にあるガイガー=ミュラー計数管

Someone has set up a live stream allowing to read a Geiger meter in Chiba prefecture. Chiba is located in the East part of Tokyo prefecture (but exact location of the device is unknown to us). The value displayed is in micro Sievert per hour (μSv/h).

以下のリンックで千葉県にあるガイガー=ミュラー計数管を見えます。

http://www.ustream.tv/channel/geiger-counter-chiba


Afficher Fukushima Plume (Sensors and Measurements) sur une carte plus grande