Tuesday, April 5
- • 2011-04-05 12Z - forecast only
- • 2011-04-05 06Z - forecast only
- • 2011-04-05 00Z - forecast only
Monday, April 4
• 2011-04-04 12Z - forecast only
• 2011-04-04 06Z - forecast only
• 2011-04-04 00Z - forecast only


Sunday, April 3
• 2011-04-03 12Z - forecast only
• 2011-04-03 06Z - forecast only
• 2011-04-03 00Z - forecast only
Saturday, April 2
• 2011-04-02 18Z - forecast only
• 2011-04-02 12Z - forecast only
• 2011-04-02 06Z - forecast only
• 2011-04-02 00Z - forecast only


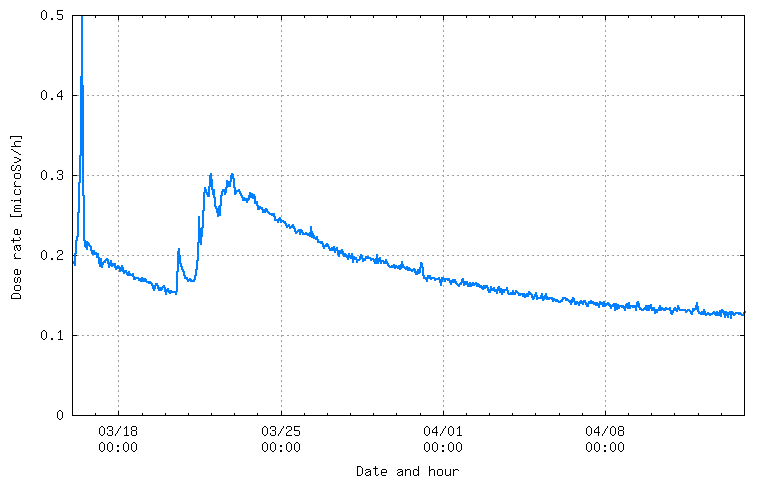
Cooling of spent fuel pools At approximately 8:21 am, March 20th, water discharge to Unit 4 by fire engine has started with the cooperation of Self-Defense Forces.Or because the graph shows counting performed for the whole day in California (as opposed to actual time period) another later event:
Cooling of Spent Fuel From 3: 05 PM to 5: 20 PM on March 20th, 40 tons of seawater was injected into Unit 2 by TEPCO employees.


Friday, April 1
• 2011-04-01 12Z - forecast only
• 2011-04-01 06Z - forecast only
• 2011-04-01 00Z - forecast only
Dates and times are shown in international format: YYYY-MM-DD HHZ. The Z indicates that the hours are given in Coordinated Universal Time (UTC or Greenwich time).
Japan is 9 hours ahead of UTC. (00Z is 9:00 a.m. in Japan.)
That spike has been attributed to "rain" in sources that I've seen, for example in Daniel Garcia's graph here: http://twitpic.com/4f0qfrThe graph no longer exists but it showed the dose rate increase with a mention of "rain" next to it. I responded with:
Thanks for the comment and info. Rain is just the final means by which the radioactive components eventually are deposited in some area ( on some sensors). What is important to understand is how this is transported. In this entry, I am trying to figure out what is the possible source term at the plant that could have triggered this increase in the dose rate. With the help of the Texas A&M computations showing the delayed transport between the plant and some other area, it looks plausible to have this event be the cooling of the spent fuel pool of reactor 2 being the culprit. The cooling must have produced evaporation that eventually fed into the plume. The Texas A&M computation seem to suggest that there is a good fit between the time this event happened and the time is was detected several hours later in Ibakari. If you have any other source of information, I would love to hear about them.


Cooling of Spent FuelFrom 3: 05 PM to 5: 20 PM on March 20th, 40 tons of seawater was injected into Unit 2 by TEPCO employees.


Japan Confirms Plutonium in Soil Samples at Fukushima Daiichi.After taking soil samples at the Fukushima Daiichi nuclear power plant, Japanese authorities today confirmed finding traces of plutonium that most likely resulted from the nuclear accident there. The Nuclear and Industrial Safety Agency told the IAEA that the Tokyo Electric Power Company (TEPCO) had found concentrations of plutonium in two of five soil samples.Traces of plutonium are not uncommon in soil because they were deposited worldwide during the atmospheric nuclear testing era. However, the isotopic composition of the plutonium found at Fukushima Daiichi suggests the material came from the reactor site, according to TEPCO officials. Still, the quantity of plutonium found does not exceed background levels tracked by Japan's Ministry of Education, Culture, Sports, Science and Technology over the past 30 years.
....Several populations of people who have been exposed to plutonium dust (e.g. people living down-wind of Nevada test sites, Hiroshima survivors, nuclear facility workers, and "terminally ill" patients injected with Pu in 1945–46 to study Pu metabolism) have been carefully followed and analyzed.These studies generally do not show especially high plutonium toxicity or plutonium-induced cancer results.[88] "There were about 25 workers from Los Alamos National Laboratory who inhaled a considerable amount of plutonium dust during the 1940's; according to the hot-particle theory, each of them has a 99.5% chance of being dead from lung cancer by now, but there has not been a single lung cancer among them."[94][95]...
Dear Igor,
... I finally found a little time to look at your blog. I like the way that you are bringing things together.
The model that I am running is good for giving a general idea of where a release might go on the large scale. The resolution of the global winds is about 50 km. At that resolution, the model does a poor job of representing the mountainous topography of Japan. My maps should not be called an 'aerosol simulation', as they have no aerosol physics in them, just passive advection by the winds....
Monday, March 28
• 2011-03-28 12Z - forecast only
• 2011-03-28 06Z - forecast only
• 2011-03-28 00Z - forecast only

The press releases are here: number 3 and 4.Measurement results were published in the United States by the protection agency(EPA - http://www.epa.gov/japan2011/). They show small traces of radioactive products released during the Fukushima accident, were detected on filters as atmospheric dust samples in California (San Francisco, Riverside, Anaheim) and in the state of Washington (Seattle) on the west coast. Radionuclides are identified 131, tellurium 132, iodine 132 and cesium 137. Concentrations measured on March 18 for those elements are a few tenths of a mBq / m3 or lower. In Scandinavia, iodine 131 was measured in air in Stockholm, Umeå and Kiruna (Sweden) at a concentration of less than 0.30 mBq / m3, in Finland (less than 1 mBq / m3), Germany (0.33 mBq / m3 for all artificial radionuclides detected) for samples performed between 22 and 23 March. In the Netherlands, iodine was also detected in air: a concentration of 0.17 mBq / m3. These results are consistent, in terms of date and order of magnitude, with forecasts performed by Météo France at the global level, in collaboration with IRSN. They confirm particularly in Europe, the dispersed radioactive elements came from the north, as provided for the modeling of Météo France.
Sunday, March 27
• 2011-03-27 12Z - forecast only
• 2011-03-27 06Z - forecast only
• 2011-03-27 00Z - forecast only

Finally, there are a huge number of possible breakdown products from nuclear fission in a reactor and yet the Seattle team found evidence of only three fission product elements--iodine, cesium and tellurium. "This points to a specifific process of release into the atmosphere," they say.
Cesium Iodide is highly soluble in water. So these guys speculate that what they're seeing is the result of contaminated steam being released into the atmosphere. "Chernobyl debris, conversely, showed a much broader spectrum of elements, reflecting the direct dispersal of active fuel elements," they say.

At approximately 4:00 pm, March 21st, light gray smoke was confirmed arising from the floor roof of the Unit 3 building. On March 22nd, the color of smoke changed to somewhat white and it is slowly dissipating.-At approximately 10:45 pm on March 22nd, the light in the main control room was turned on.-At around 4:20 pm on March 23rd, our staff confirmed light black smoke belching from the Unit 3 building. At approximately 11:30 pm on March 23rd and 4:50 am on March 24th, our employee found no signs of smoke.
7:00 am GMT March 21st: light gray smoke
7:20 am March 23rd: light black smoke

We report results of air monitoring started due to the recent natural catastrophe on March 11, 2011 in Japan and the severe ensuing damage to the Fukushima nuclear reactor complex. On March 17-18, 2011 we detected the first arrival of the airborne fission products 131-I, 132-I, 132-Te, 134-Cs, and 137-Cs in Seattle, WA, USA, by identifying their characteristic gamma rays using a germanium detector. The highest detected activity to date is less than 32 mBq/m^3 of 131-I.

Saturday, March 26• 2011-03-26 12Z - forecast only• 2011-03-26 06Z - forecast only• 2011-03-26 00Z - forecast only

Marian Steinbach has started putting the readings she obtained from the SPEED! network into a small video. This is outstanding. If we could include all the data from all the sensor networks and have a similar video from the plumes, I am sure we could begin to infer somethingThe puffs of smoke that have caused temporary evacuations of the control rooms have not been accompanied by increases in radiation. A gray or black color could indicate a fire, while white “smoke” is more likely steam.
From the FEPC reports, the spent fuel pools at Units 2, 5, and 6 are at acceptable temperatures. Water is being added to the pools at Units 3 and 4, but no temperature is given. The reactor cores in Units 1, 2, and 3 remain partially uncovered by water, but the fact that their containment is holding pressure suggests that there are no large breaches.


Saturday, March 19
• 2011-03-19 18Z - analysis + forecast
• 2011-03-19 12Z - analysis + forecast
• 2011-03-19 06Z - analysis + forecast
• 2011-03-19 00Z - analysis + forecast
Friday, March 18
• 2011-03-18 18Z - analysis + forecast
• 2011-03-18 12Z - analysis + forecast
• 2011-03-18 06Z - analysis + forecast
• 2011-03-18 00Z - analysis only
Thursday, March 17
• 2011-03-17 18Z - analysis only
• 2011-03-17 12Z - analysis only
• 2011-03-17 06Z - analysis only
• 2011-03-17 00Z - analysis only
Friday, March 25
• 2011-03-25 12Z - forecast only
• 2011-03-25 06Z - forecast only
• 2011-03-25 00Z - forecast only
Thursday, March 24
• 2011-03-24 18Z - forecast only
• 2011-03-24 12Z - forecast only
• 2011-03-24 06Z - forecast only
• 2011-03-24 00Z - forecast only


Tuesday, March 152011-03-15 00Z - analysis only (time of reported fire in reactor #4)

Monday, March 14 • 2011-03-14 21Z - analysis only (time of reported explosion in reactor #2)