Friday, April 1
• 2011-04-01 12Z - forecast only
• 2011-04-01 06Z - forecast only
• 2011-04-01 00Z - forecast only
Dates and times are shown in international format: YYYY-MM-DD HHZ. The Z indicates that the hours are given in Coordinated Universal Time (UTC or Greenwich time).
Japan is 9 hours ahead of UTC. (00Z is 9:00 a.m. in Japan.)
In the Ibakari Analysis for the March 21st sudden dose rate increase, David, a commenter, pointed out the following:
That spike has been attributed to "rain" in sources that I've seen, for example in Daniel Garcia's graph here: http://twitpic.com/4f0qfrThe graph no longer exists but it showed the dose rate increase with a mention of "rain" next to it. I responded with:
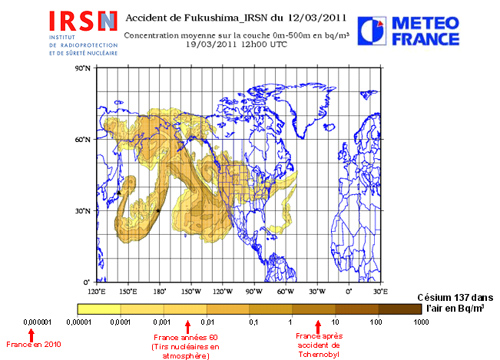
Thanks for the comment and info. Rain is just the final means by which the radioactive components eventually are deposited in some area ( on some sensors). What is important to understand is how this is transported. In this entry, I am trying to figure out what is the possible source term at the plant that could have triggered this increase in the dose rate. With the help of the Texas A&M computations showing the delayed transport between the plant and some other area, it looks plausible to have this event be the cooling of the spent fuel pool of reactor 2 being the culprit. The cooling must have produced evaporation that eventually fed into the plume. The Texas A&M computation seem to suggest that there is a good fit between the time this event happened and the time is was detected several hours later in Ibakari. If you have any other source of information, I would love to hear about them.
Thanks David. I can see also the point that dose rate increase only when it rains because somehow the radiation is diffused all around as opposed to following specific trajectories such as the ones the Texas A&M team is computing.. However, while rain occurred in that area on March 21st ( http://weatherspark.com/#!graphs;ws=33162 ), there has been other rain events since with no corresponding large dose rate increase.
As can be seen from the SPEED! and other prefecture measurements graph at http://fleep.com/earthquake/ .Here is the Ibakari graph:
In other words, the insertion of sea water in the spent fuel pool of reactor 4 on March 21st, seems consistent with the dose rate increase in Ibakari several hours later (please note that I am not saying it is the only reason, just that it seems consistent based on the incomplete data we have so far). In particular, the trajectory computations show the possibility of the particles born from the cooling of the fuel rods to be over Ibakari in the right time frame. The rain is probably a compounding element that enabled the 4 microSv/hr dose rate increase as detected by the prefecture measurements.
Dr. Matthias Braun from Areva produced a presentation, available from Energy from Thorium, that provides a background to folks who do not know nuclear systems, All the information in that presentation stem from data gathered from different sources accessible over the internet. Of interest are the following two slides. The first one is a timeline that stops just before March 21st and the second shows how different the accident in the pool at reactor #4 is with regards to radiological release from similar release from reactor 1 through 3. As stated in the presentation, we do not know if these releases have occurred already.Let us note that the presentation talks about pool #4 whereas the dose rate increase seems consistent with water thrown in pool #2.
.


