Thursday, March 31, 2011

Fukushima: Texas A&M Forecasts for April 1, A note on the Ibakari Analysis of March21st.

The Texas A&M forecasts are in:
Friday, April 1
 2011-04-01 12Z - forecast only
 2011-04-01 06Z - forecast only
 2011-04-01 00Z - forecast only
Dates and times are shown in international format:  YYYY-MM-DD HHZ.  The Z indicates that the hours are given in Coordinated Universal Time (UTC or Greenwich time).
Japan is 9 hours ahead of UTC.  (00Z is 9:00 a.m. in Japan.)

In the Ibakari Analysis for the March 21st sudden dose rate increase, David, a commenter, pointed out the following:

That spike has been attributed to "rain" in sources that I've seen, for example in Daniel Garcia's graph here: http://twitpic.com/4f0qfr
The graph no longer exists but it showed the dose rate increase with a mention of "rain" next to it. I responded with:

Thanks for the comment and info. Rain is just the final means by which the radioactive components eventually are deposited in some area ( on some sensors). What is important to understand is how this is transported. In this entry, I am trying to figure out what is the possible source term at the plant that could have triggered this increase in the dose rate. With the help of the Texas A&M computations showing the delayed transport between the plant and some other area, it looks plausible to have this event be the cooling of the spent fuel pool of reactor 2 being the culprit. The cooling must have produced evaporation that eventually fed into the plume. The Texas A&M computation seem to suggest that there is a good fit between the time this event happened and the time is was detected several hours later in Ibakari. If you have any other source of information, I would love to hear about them.

Thanks David. I can see also the point that dose rate increase only when it rains because somehow the radiation is diffused all around as opposed to following specific trajectories such as the ones the Texas A&M team is computing.. However, while rain occurred in that area on March 21st ( http://weatherspark.com/#!graphs;ws=33162 ), there has been other rain events since with no corresponding large dose rate increase.

As can be seen from the SPEED! and other prefecture measurements graph at http://fleep.com/earthquake/ .Here is the Ibakari graph:

In other words, the insertion of sea water in the spent fuel pool of reactor 4 on March 21st, seems consistent with the dose rate increase in Ibakari several hours later (please note that I am not saying it is the only reason, just that it seems consistent based on the incomplete data we have so far). In particular, the trajectory computations show the possibility of the particles born from the cooling of the fuel rods to be over Ibakari in the right time frame. The rain is probably a compounding element that enabled the 4 microSv/hr dose rate increase as detected by the prefecture measurements. 

Dr. Matthias Braun from Areva produced a presentation, available from Energy from Thorium, that provides a background to folks who do not know nuclear systems, All the information in that presentation stem from data gathered from different sources accessible over the internet. Of interest are the following two slides. The first one is a timeline that stops just before March 21st and the second shows how different the accident in the pool  at reactor #4 is with regards to radiological release from similar release from reactor 1 through 3. As stated in the presentation, we do not know if these releases have occurred already.Let us note that the presentation talks about pool #4 whereas the dose rate increase seems consistent with water thrown in pool #2.
.


Fukushima: Ibakari Analysis for March 21st.

I wanted to come back to an dose rate increase in Ibakari that occurred on March 21st at 10:00 am. From here:

According to the TEPCO press release on March 20th, the only event I could find is the cooling of the spent fuel of reactor 2:

Cooling of Spent FuelFrom 3: 05 PM to 5: 20 PM on March 20th, 40 tons of seawater was injected into Unit 2 by TEPCO employees.

On the 22th, at 21:00 JST on March 22, there is a drop, that coincides with a westerly wind. Then the dose rate goes up as the winds comes back to the Ibakari region. So it looks like from the information currently available, the cooling of the pool in reactor 2 and attendant vapor generation might be responsible for this increase in dose rate in Ibakari.

Wednesday, March 30, 2011

Fukushima: TAMU Forecast March 31st, Analysis for Ibakari

The Texas A&M prediction maps for tomorrow are in:


Thursday, March 31
  1.  2011-03-31 12Z - forecast only
  2.  2011-03-31 06Z - forecast only
  3.  2011-03-31 00Z - forecast only

Please note that 06Z means 6:00 GMT or (6:00 + 9:00) 15:00 JST.

Yesterday, the prediction showed some trajectories going in the direction of Ibakari. Yesterday's map of the  region showed:


 Today's readings show the following map:

At first, there is no obvious difference using the color coding of that map. The historical charts in the same region show the following trend:

or a tiny increase of less than 0.2 microSv/hr at Takahagi. The map from Texas A&M is the one dated March 29th at 18 GMT or March 30 03:00 JST:


Tuesday, March 29, 2011

Fukushima: TAMU Forecasts March 30th, Source term around the plant.

The Texas A&M forecasts are in for tomorrow Wednesday March 30th:


Wednesday, March 30
  1.  2011-03-30 12Z - forecast only
  2.  2011-03-30 06Z - forecast only
  3.  2011-03-30 00Z - forecast only


Let us note that 06Z means 6:00 GMT or (6:00 + 9:00) 15:00 JST

From the IAEA press release:


Fukushima Daiichi Nuclear Accident Update (28 March, 23:00 UTC)

Japan Confirms Plutonium in Soil Samples at Fukushima Daiichi.After taking soil samples at the Fukushima Daiichi nuclear power plant, Japanese authorities today confirmed finding traces of plutonium that most likely resulted from the nuclear accident there. The Nuclear and Industrial Safety Agency told the IAEA that the Tokyo Electric Power Company (TEPCO) had found concentrations of plutonium in two of five soil samples.
Traces of plutonium are not uncommon in soil because they were deposited worldwide during the atmospheric nuclear testing era. However, the isotopic composition of the plutonium found at Fukushima Daiichi suggests the material came from the reactor site, according to TEPCO officials. Still, the quantity of plutonium found does not exceed background levels tracked by Japan's Ministry of Education, Culture, Sports, Science and Technology over the past 30 years.

It is important to realize that plutonium is already in the background in large part because of atomic weapons test performed in the 1950s and 1960s in the atmosphere. These tests released plumes of these materials in the atmosphere. The TEPCO/Fukushima anlysis shows specifically that these soil samples have elements of the reactors as the composition of fissile material is different from the atmospheric tests of the 50-60s. From  wikipedia, here is historical account on the truely known toxicity of Plutonium:

....Several populations of people who have been exposed to plutonium dust (e.g. people living down-wind of Nevada test sites, Hiroshima survivors, nuclear facility workers, and "terminally ill" patients injected with Pu in 1945–46 to study Pu metabolism) have been carefully followed and analyzed.
These studies generally do not show especially high plutonium toxicity or plutonium-induced cancer results.[88] "There were about 25 workers from Los Alamos National Laboratory who inhaled a considerable amount of plutonium dust during the 1940's; according to the hot-particle theory, each of them has a 99.5% chance of being dead from lung cancer by now, but there has not been a single lung cancer among them."[94][95]...

Monday, March 28, 2011

Fukushima: TAMU Forecasts Tuesday March 29, a note on the TAMU model, Microsievert.net

Texas A&M Forecasts and status updates are in;


Tuesday, March 29
  1.  2011-03-29 12Z - forecast only
  2.  2011-03-29 06Z - forecast only
  3.  2011-03-29 00Z - forecast only

I have had a small exchange with Dr. Ken Bowman on the model used for these simulations:

Dear Igor,

... I finally found a little time to look at your blog. I like the way that you are bringing things together.

The model that I am running is good for giving a general idea of where a release might go on the large scale. The resolution of the global winds is about 50 km. At that resolution, the model does a poor job of representing the mountainous topography of Japan. My maps should not be called an 'aerosol simulation', as they have no aerosol physics in them, just passive advection by the winds....

Thanks Ken.

Finally, microsioevert.net is a new site featuring a different kind of vizualisation than we have been accustomed to,

Sunday, March 27, 2011

Fukushima: Texas A&M Forecasts Mon March 28, Plume detection in France and other countries, Radiation Measurements and Standards

The Texas A&M forecasts are in:
Monday, March 28
 2011-03-28 12Z - forecast only
 2011-03-28 06Z - forecast only
 2011-03-28 00Z - forecast only

And it looks like the winds are going westerly. In other news, the French Teleray radiation sensor network has detected the plume in metropolitan France. All measurements show that the plume is in the background. The following graph show radiation level average over a month and radiation level for the plume:


Of interest is a summary of what was found in other countries:

Measurement results were published in the United States by the protection agency(EPA - http://www.epa.gov/japan2011/). They show small traces of radioactive products released during the Fukushima accident, were detected on filters as atmospheric dust samples in California (San Francisco, Riverside, Anaheim) and in the state of Washington (Seattle) on the west coast. Radionuclides are identified 131, tellurium 132, iodine 132 and cesium 137. Concentrations measured on March 18 for those elements are a few tenths of a mBq / m3 or lower. In Scandinavia, iodine 131 was measured in air in Stockholm, Umeå and Kiruna (Sweden) at a concentration of less than 0.30 mBq / m3, in Finland (less than 1 mBq / m3), Germany (0.33 mBq / m3 for all artificial radionuclides detected) for samples performed between 22 and 23 March. In the Netherlands, iodine was also detected in air: a concentration of 0.17 mBq / m3. These results are consistent, in terms of date and order of magnitude, with forecasts performed by Météo France at the global level, in collaboration with IRSN. They confirm particularly in Europe, the dispersed radioactive elements came from the north, as provided for the modeling of Météo France.
The press releases are here: number 3 and 4.

Chreyl Rofer has two blog entries of interest with regards to radiation measurements and exposure.

Saturday, March 26, 2011

Fukushima: Texas A&M Forecasts Sun March 27, Air Share, Comments on Source Term

The Texas A&M predictions just came out:

Sunday, March 27
 2011-03-27 12Z - forecast only
 2011-03-27 06Z - forecast only
 2011-03-27 00Z - forecast only

The Google Maps Mania blog pointed out to another instance of trajectory computation called Shared Air by the folks at University of Michigan. In these maps, you choose a city in Japan and figure out if the winds and particle came from Fukushima. It really is the reverse problem that the Texas A&M computations do.


Cheryl Rofer has a series of blog entries of interest to plume:

Is There a Leak at Fukushima #3?
And Now...Becquerels!
If You're Anywhere But Japan, Don't Take Potassium Iodide!

Frank Munger mentions the fact that Oak Ridge National Lab (ORNL) is providing computational suport to DOE on the modeling of what is currently going on in each of the reactors and pools.

Friday, March 25, 2011

Fukushima: Source Term Analysis in Seattle. Potential understanding of Unit 3 fumes.

[Update: The folks at the Unversity of Washington are now aware of this opportunity]

The arxiv blog just featured a paper that appeared on arxiv that points to an analysis of the plume that landed at the University of Washington in Seattle. The paper is at the end of this entry. A good summary is here, from the text:
Finally, there are a huge number of possible breakdown products from nuclear fission in a reactor and yet the Seattle team found evidence of only three fission product elements--iodine, cesium and tellurium. "This points to a specifific process of release into the atmosphere," they say.

Cesium Iodide is highly soluble in water. So these guys speculate that what they're seeing is the result of contaminated steam being released into the atmosphere. "Chernobyl debris, conversely, showed a much broader spectrum of elements, reflecting the direct dispersal of active fuel elements," they say.

If one checks the Texas A&M predictions, arrival in Seattle on March 17-18 can be assumed thanks to this map that assumes ejection around 12 GMT on March 13th (or 21 JST March 13th)


This would correspond to an event in Unit 3 according to this map.

The folks at University of Washington ought to be looking at the Texas A&M simulations to see if and when they are going to catch up elements of the plumes.

Unit 3 is still a concern today as an analysis of the water outside of the secondary containment has shown elements such as Technetium-99m (Thanks David).

To see if the plume contains some of these elements, we ought to be looking at the smoke that left unit 3. As per TEPCO's report:

At approximately 4:00 pm, March 21st, light gray smoke was confirmed arising from the floor roof of the Unit 3 building. On March 22nd, the color of smoke changed to somewhat white and it is slowly dissipating.
-At approximately 10:45 pm on March 22nd, the light in the main control room was turned on.
-At around 4:20 pm on March 23rd, our staff confirmed light black smoke belching from the Unit 3 building. At approximately 11:30 pm on March 23rd and 4:50 am on March 24th, our employee found no signs of smoke.

If one converts these dates from JST to GMT, we have:

7:00 am GMT March 21st: light gray smoke
7:20 am March 23rd: light black smoke

A simulation for the March 21st event was performed for 6:00 am and it shows that plume hitting Seattle tomorrow.


A simulation for the second event does not seem as conclusive.


The paper: Arrival time and magnitude of airborne fission products from the Fukushima, Japan, reactor incident as measured in Seattle, WA, USA by J. Diaz Leon, J. Kaspar, A. Knecht, M. L. Miller, R. G. H. Robertson, A. G. Schubert. The abstract reads:
We report results of air monitoring started due to the recent natural catastrophe on March 11, 2011 in Japan and the severe ensuing damage to the Fukushima nuclear reactor complex. On March 17-18, 2011 we detected the first arrival of the airborne fission products 131-I, 132-I, 132-Te, 134-Cs, and 137-Cs in Seattle, WA, USA, by identifying their characteristic gamma rays using a germanium detector. The highest detected activity to date is less than 32 mBq/m^3 of 131-I.

Fukushima: Texas A&M Forecasts Sat March 25, A Challenge ?, Other assessments and radiation monitoring networks

The Texas A&M forecasts are in for tomorrow:
Saturday, March 26
 2011-03-26 12Z - forecast only
 2011-03-26 06Z - forecast only
 2011-03-26 00Z - forecast only

If the trend is correct, the plume is likely to be conveyed away from Japanese land for tomorrow. It also shows the plume aiming for the Philippines. If the plume is the same as it has been for the past week as it spread to the US, it will not yield appreciable dose. Ken Bowman, the initiator of the Texas A&M simulations let me know that I should not use the term aerosol simulation for his simulations "as they have no aerosol physics in them, just passive advection by the winds.". Thanks Ken for the correction.

I am wondering if we should not have some type of challenge that would ask people to show side by side  how simulations and sensor networks measurements could be compared. 

The DOE site about the situation in Japan is here. While they have provided data on the ground from their assessment team, I have not seen any result from plume simulations from their center at Livermore. Of interest is the mention in USA Today of an assessment performed by some IAEA/Japan team around Fukushima. I am not sure I have seen these results on the web.


In the meantime, I have come across two country-wide maps of interest for generic radiation sensor network monitoring who are seemingly not affected by the Fukushima plume.

Thursday, March 24, 2011

Fukushima: Timelines, the Fog of Data, Comparing the DOE data and Texas A&M's simulations, Forecasts

The Neutroneconomy blog has an update on Dose Readings in Japan.and provides some analysis of the plumes and their detection. Also via the Neutroneconomy blogR.C Hoetzlein provides a very nice timeline.
There is another one on the NYT.

Having a good timeline should allow us to make a better comparison with the Texas A&M simulations and readings on the ground. To the untrained eye it looks like there is only one set of sensors. However, the fog of data is fed from are several sensor networks. There are:
Beside the atmospheric ground measurements, there are also tap water measurements (see graphs).

We have updated a google maps featuring the MEXT data and some other data we  mentioned in the blog before:


View Fukushima Plume (Sensors and Measurements) in a larger map


The Radiation data from the SPEED! network can also be found on this map.

With regards to the source term, the Fukushima Dai-ichi plant, Cheryl Rofer  has a take on the white smoke coming out of the plant:
The puffs of smoke that have caused temporary evacuations of the control rooms have not been accompanied by increases in radiation. A gray or black color could indicate a fire, while white “smoke” is more likely steam.

From the FEPC reports, the spent fuel pools at Units 2, 5, and 6 are at acceptable temperatures. Water is being added to the pools at Units 3 and 4, but no temperature is given. The reactor cores in Units 1, 2, and 3 remain partially uncovered by water, but the fact that their containment is holding pressure suggests that there are no large breaches. 
Marian Steinbach has started putting the readings she obtained from the SPEED! network into a small video. This is outstanding. If we could include all the data from all the sensor networks and have a similar video from the plumes, I am sure we could begin to infer something

Here is the SPEEDI Radiation Data Animation - Draft (Mar 20, 00:00 to Mar 23, 15:20 UTC)


As I was looking at the trajectory computations by the fine folks at Texas A&M and the aerial assessment provided by DOE yesterday, I am in need of an explanation: Namely, if you look at the DOE measurements, there is red corridor going up on the left of Fukushima Dai-ichi:


yet when one check the Texas A&M simulations, only a period of potentially six hours provided this region to the exposure to the plume.namely:


The three days worth of simulation by Texas A&M and covered by the DOE survey are:
Saturday, March 19
 2011-03-19 18Z - analysis + forecast
 2011-03-19 12Z - analysis + forecast
 2011-03-19 06Z - analysis + forecast
 2011-03-19 00Z - analysis + forecast
Friday, March 18
 2011-03-18 18Z - analysis + forecast
 2011-03-18 12Z - analysis + forecast
 2011-03-18 06Z - analysis + forecast
 2011-03-18 00Z - analysis only
Thursday, March 17
 2011-03-17 18Z - analysis only
 2011-03-17 12Z - analysis only
 2011-03-17 06Z - analysis only
 2011-03-17 00Z - analysis only

Finally, here are the new Texas A&M forecast for today and tomorrow (times are in GMT).

Friday, March 25
 2011-03-25 12Z - forecast only
 2011-03-25 06Z - forecast only
 2011-03-25 00Z - forecast only
Thursday, March 24
 2011-03-24 18Z - forecast only
 2011-03-24 12Z - forecast only
 2011-03-24 06Z - forecast only
 2011-03-24 00Z - forecast only

Wednesday, March 23, 2011

Fukushima: U.S. Department of Energy Aerial and Ground Monitoring Data

The U.S Department of Energy just issued a press release and a presentation that featured aerial and ground measurement data. In the presentation there is also a mention of a ground US monitoring station deployed by their Consequence Management Response Teams near Fukushima. (Download the presentation here)


Fukushima: Levels of radioactive iodine and cesium in tap water

The Japanese Ministry of Education, Culture, Sport, Science and Technology (MEXT), which has published charts we already referenced here (they are now available from our map) of the levels of radiation measured in all prefectures, also published charts of the levels of radioactive iodine 131 and cesium 137 measured in tap water.

Those charts are gathered on this page (link to the source is available).

Tuesday, March 22, 2011

Fukushima: Texas A&M simulation vs ground measurements

One of the "raison d'etre" of this blog is to compare ground measurements from government or citizen sensor networks and the diverse computational simulations used to model man made or natural plumes. While the French ISRN has performed some computations, its own sensor network is likely to not going to be able to pick up the radiation as it is likely to be in the background when it reaches metropolitan France. At Texas A&M,   Kenneth Bowman, Cameron  Homeyer have continued providing computation of the transport of aerosols from the Fukushima plant. How do these computations compare with the readings from the different government owned sensor networks ?. In particular, how do these measurements compare with the two events listed in the Texas A&M maps.?

The fire at Reactor 4 took place at 9:40 am March 15 JST (0:40 March 15 GMT) while the explosion of reactor 2 took place earlier at 6:10 a.m (21:10 March 14 GMT) that day (see here for references)


Tuesday, March 152011-03-15 00Z - analysis only (time of reported fire in reactor #4)

According to the trajectories, four ticks later (12 hours later) it is over Ibakari prefecture. The first peak is at 6 AM JST on March 16th (21:00 GMT March 15th). While the red tracks goes south, the green and blue stays over that prefecture and are a therefore consistent with the peak recorded there at 6AM JST (21 hours later). But that measurement is also consistent with the explosion at reactor #2.(24 hours later) as can be seen in the following map.


Monday, March 14  2011-03-14 21Z - analysis only (time of reported explosion in reactor #2)

So from a first reading of these maps, it does not look feasible to evaluate which of these two accidents is contributing to the measurements on the ground. Let us also not that the days after may 16, 17, the aerosols went over the pacific ocean.thereby reducing the dose to the land.

Monday, March 21, 2011

Fukushima: New plumes, SPEED measurements and Cs and I measurements in Tokyo.

So far today, there have been reports of produce contamination in he Ibakari prefecture and the fact that two plumes formed and were the reasons for the evacuation of workers at Fukushima. One should note that the detector at Fukushima are not being given in the SPEED network and so we get to see only readings further away from the plume source. As one can see from the report above,  there have an increase in the dose rate on March 21 in the Ikabari prefecture. A similar trend can be found in the detection performed for Cesium 137, Cesium 134, iodine 132 and iodine 131 performed in Tokyo. From the data [1], one can categorize the following days with background level measurements: March 17March 18  March 19,  March 20 while March 15March 16March 21 show much larger contributions. We should remain with an above average contribution for March 22. 

The background levels are estimated by comparing the values to the background values at UCBerkeley. Let us note that these measurements are extracted because each of these elements have a specific gamma signature. Geiger counters being considered for monitoring the plume do not detect the same thing. In particular, in Geiger counters, there is no discrimination in energy.


If we take the measurements of the SPEED network for Hairando (south of Tokyo), the jump seen in the Cesium and Iodine measurement above do not show up on that network's measurement in the same area (Tokyo).


This maybe an issue of wind patterns. One can also regret that while there are a few models looking into the plume displacement over the whole globe, there seems to be scant simulation focused only on Japan.


[1] Source: Department of Health and Welfare, Tokyo

Fukushima: A radiation dose chart

Randal Munroe, famous for being the author or XKCD, has published with the help of some other people a chart giving a glimpse of the meaning of radiation levels. As he states himself, this chart is not meant to be a scientific reference, but it still proves very helpful in putting in perspective a given radiation level.

Sources used are credited on the page.

http://xkcd.com/radiation/

Sunday, March 20, 2011

Fukushima: Japanese Radiation Monitoring Data Google Maps Mashup, Fukushima source term

Marian Steinbach decided to scrape the radiation monitoring data from the Japanese Radiation Monitoring Network (SPEED) we featured earlier here, so that people would be able to use these data for potential mash-ups. ( see An Update on Radiation Data from Japan ). Then, Geir Engdahl put this data in a google maps. The data is refreshed every ten minutes.


Eron Villarreal has put this data in a data dashboard using Tableau Software.


In particular south of Fukushima, near the town of Hitachinaka, we can see:

Here the dose is in nanoGray/hr. 3000  nGy/hr is equivalent to 3 microSv/hr given a weighting factor of 1.

It would be great if any simulations performed by any of the outfits we have mentioned earlier were to provide their data in a format that can fit a Google Maps mashup format (if you are one of these researchers but don't know how to go about this please contact us).

Fukushima: Measured amount of iodine and cesium in atmosphere in Setagaya ku, Tokyo | 東京都世田谷区内で計測された大気中のヨウ素及びセシウム素

The following page reports on a day to day basis levels of iodine 131, iodine 132, cesium 134 and cesium 137 as measured in the atmosphere in Setagaya ku, in Tokyo. The documents are in Japanese, but spreadsheets should be understandable.

http://www.sangyo-rodo.metro.tokyo.jp/whats-new/measurement.html


Afficher Fukushima Plume (Sensors and Measurements) sur une carte plus grande

Saturday, March 19, 2011

Fukushima: Status of the Fukushima 1 power plant (as of March 18th, 22h00)

A spreadsheet of the status of the Fukushima 1 power plant as of March 18, 22h00, has been published by JAIF (Japanese Atomic Industrial Forum).

http://www.jaif.or.jp/english/aij/110318FukushimaEventStatus-14

Fukushima: French ISRN and Texas A&M Simulation of Fukushima plume from March 12 to March 22: Tokyo and Global scale

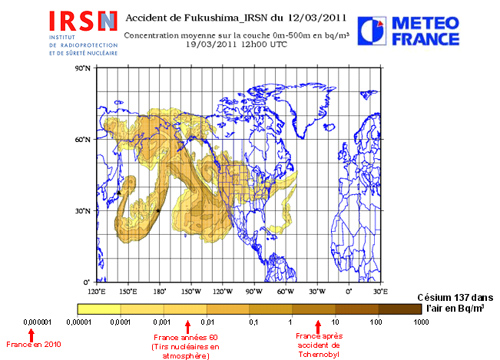
Today, the French ISRN released some results of its computation of the Fukushima plume over Tokyo. Another simulation shows the plume till March 25th for the whole Globe taking into consideration data from the French meteorological office. 


2 - The dispersion of radioactive releases into the atmosphere
IRSN simulated atmospheric dispersion of releases estimated between 12 and 22 March, using its numerical model applicable to long distance (scale of several hundred kilometers), using observations and weather forecasts provided by Weather France.
This simulation was applied to the cesium 137, as a tracer of the plume during this period. The modeling results are expressed in becquerels of cesium-137 per cubic meter of air (Bq / m 3).
Watch the simulation of the plume
This modeling performed throughout Japan shows that the plume has led in directions that have varied over time: first north-east until March 14, then south and southeast west toward Tokyo, March 15, then east toward the Pacific Ocean.
IRSN compared the simulation results with the results of measurements of air contamination carried in Tokyo. They are the same order of magnitude as the values ​​measured in this city, as shown in the charts below for iodine 131 and cesium 137.
This comparison allows us to consider that the air dispersion modeling performed by IRSN to produce satisfactory results for the agglomeration of Tokyo and the doses calculated by IRSN from this modeling are representative of the doses may have been received by the population exposed to the radioactive plume.


and then for the whole globe:


4 - Modeling the dispersion of radioactive releases into the atmosphere on a global scale
From the estimated releases from IRSN, Meteo France has simulated the dispersion of radioactive releases from great distances, projected until March 26.
visionner la simulation

Watch the simulation

According to this simulation, the plume would now reached the north-eastern Siberia, the United States and western Atlantic. It should reach France from 23 or 24 March.
Merger expected to run from this model could be of the order of 0,001 Bq / m 3 in France and the overseas departments of the northern hemisphere. As expected, the southern hemisphere is not significantly affected by this large-scale dispersal.
For comparison, values ​​measured in the days following the Chernobyl accident had exceeded 100 000 Bq / m 3 in the first few kilometers around the plant and they were in the range of 100 to 1000 Bq / m 3 in the country most affected by the plume (Ukraine, Belarus); France, values ​​measured in the east were the order of 1 to 10 Bq/m3 (May 1, 1986). Today, a very low activity of cesium-137 remains in the air, on the order of 0.000001 Bq/m3.

To give some perspective, as per wikipedia, one Bq is defined as the activity of a quantity of radioactive material in which one nucleus decays per second.. From the TORCH report on how to computer the dose due to Cesium from its Bequerel units::


To sum these properties up
  • The dose rate due to external irradiation from uniform contamination of the ground by 137Cs is 1.6 x 10⁻¹² Sv hr-1 Bq-1 m2.
  • The internal dose for ingestion is 1.2 x 10⁻⁸ Sv Bq-1
  • The internal dose for inhalation is 8.7 x 10⁻⁹ Sv Bq-1

The maximum for this global computation is 1000 Bq/m^3. All other colors are decreasing by increment of ten from that maximum. This number has then to be multiplied by the low numbers above to obtain a dose. As can be seen from the US EPA detectors, this dose is part of the background radiation level. Another map of interest shows that the plume modeling is different for different  research teams. The folks at Texas A&M provide computations showing particles in the plume flying at 2 to 4 km altitude while the french model is restricted to 500m high.